The instance graph gives you a visual overview of how a managed instance is being used, how it is related to other instances, and, maybe most importantly, how roots are preventing it from being garbage collected.
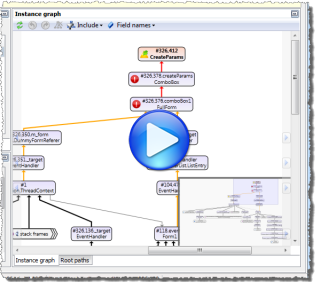
Combined instances graph
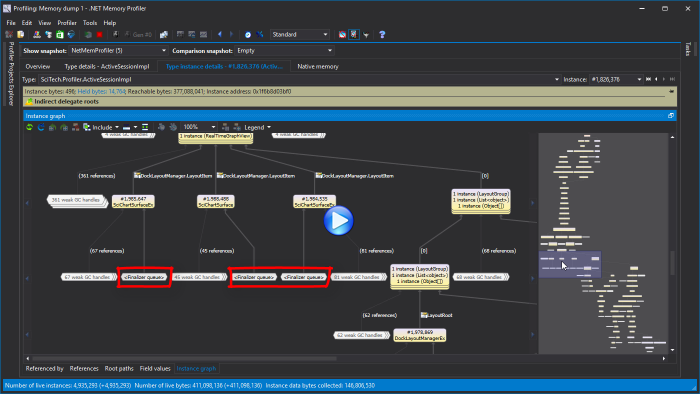
The graph under the Type/Filter details view shows the root paths of the selected instances, the instances with a specific shortest root path, or the instances that share a common allocation call stack.
Select roots to include/exclude in the instance graphs
It is possible to select which roots to include in the instance graph. This is especially useful when investigating an "inspection-only" snapshot, i.e. when the profiler has not induced a garbage collection or performed other heap clean-up actions before the snapshot.
The screencast below shows how roots can be excluded to simplify the instance graph of a suspected memory leak instance (this is based on an actual memory leak detected in a memory dump of .NET Memory Profiler).
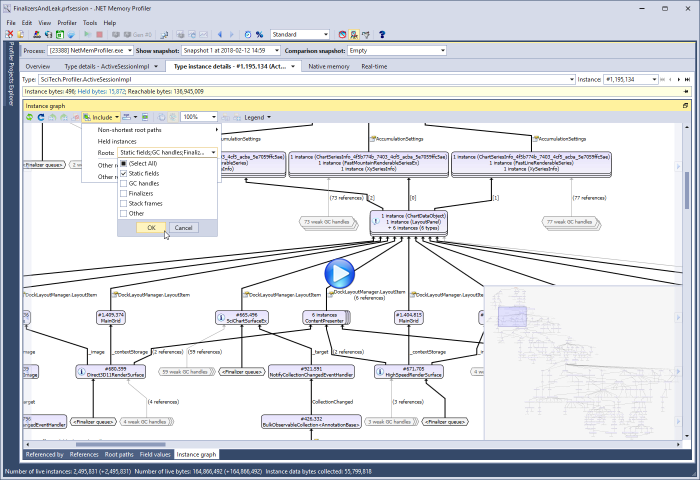
If excluding roots causes all roots to be removed, then the instance graph will consist of only the selected instance.
Investigating root paths in a large graph
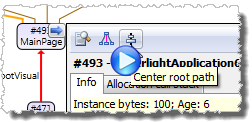
If the instance graph is large, it can be hard to locate specific root paths. In this case the Align root path command is useful. This command is available from the popup window of each instance, root, and reference in the graph, as well as from the right click menu. When selected, it will find the shortest root path that passes through the instance, root, or reference, highlight the root path and group all instances. Root paths can also be selected using the navigation buttons that are provided on the sides of the graph. For more information watch the root path navigation demo.
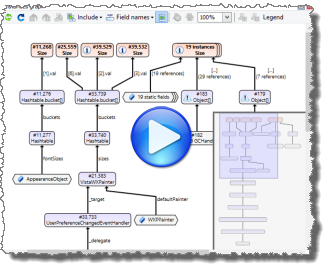
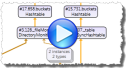
Large instance graph reduction
An instance graph can easily become much larger than can be conveniently presented visually. To avoid presenting too large graphs, .NET Memory Profiler will reduce the graph by combining groups of instances and roots into single graph nodes. The profiler tries to select groups so that the overall structure of the graph is affected as little as possible.
In-depth .NET Memory Profiling
Download .NET Memory Profiler to see how it can help you find memory leaks and optimize memory usage in your application.
Download Free Trial